Data Analyst / Analytics Engineer

Promise Ezeike

I help businesses see their data clearly, scoping the right questions with stakeholders, engineering data pipelines and dbt-tested data models, that other teams and agents caan consume, building the BI dashboards that clearly communicate insights and decisions teams can act on with confidence.

Liverpool, UK Open to entry-to-mid roles

Promise Ezeike — Data Analyst and Analytics Engineer

Analytics Engineer and Analyst.

I trained as an Industrial & Production Engineer, which gave me genuine systems thinking, understanding how processes break, where bottlenecks form, and how to optimise output. That foundation moved naturally into data: an MSc in International Business with Data Analytics gave me the commercial framing, and consulting at Amdari has put it into practice across logistics, manufacturing, SaaS, and HR. I work as a Data Analyst with hands-on range into analytics engineering, treating every dataset like a process and asking the same three questions: where does the noise come from, what's the bottleneck, and what would a stakeholder actually do with this number?

My work runs the full stack: SQL on PostgreSQL and BigQuery, dbt Core for transformation and testing, Python where it earns its place, and Power BI, Tableau, and Looker Studio for the layer that actually reaches a decision-maker. I lean into the boring parts — dimensional modelling, automated data quality tests, and the unfashionable habit of cross-validating headline numbers between layers before they reach an executive deck. Most of all, I work closely with stakeholders to scope the right questions and translate findings into clear, decision-ready recommendations.

Stack

SQL PostgreSQL BigQuery dbt Core Python Power BI DAX LangChain Looker Studio Excel · VBA GCP/Warehouse AI Agents

Six projects, six business questions.

Each project below answers a specific business question with a defensible recommendation.

02
SQL, Python · Forensics · Dimensional modelling

Seller Removal Defence Analytics

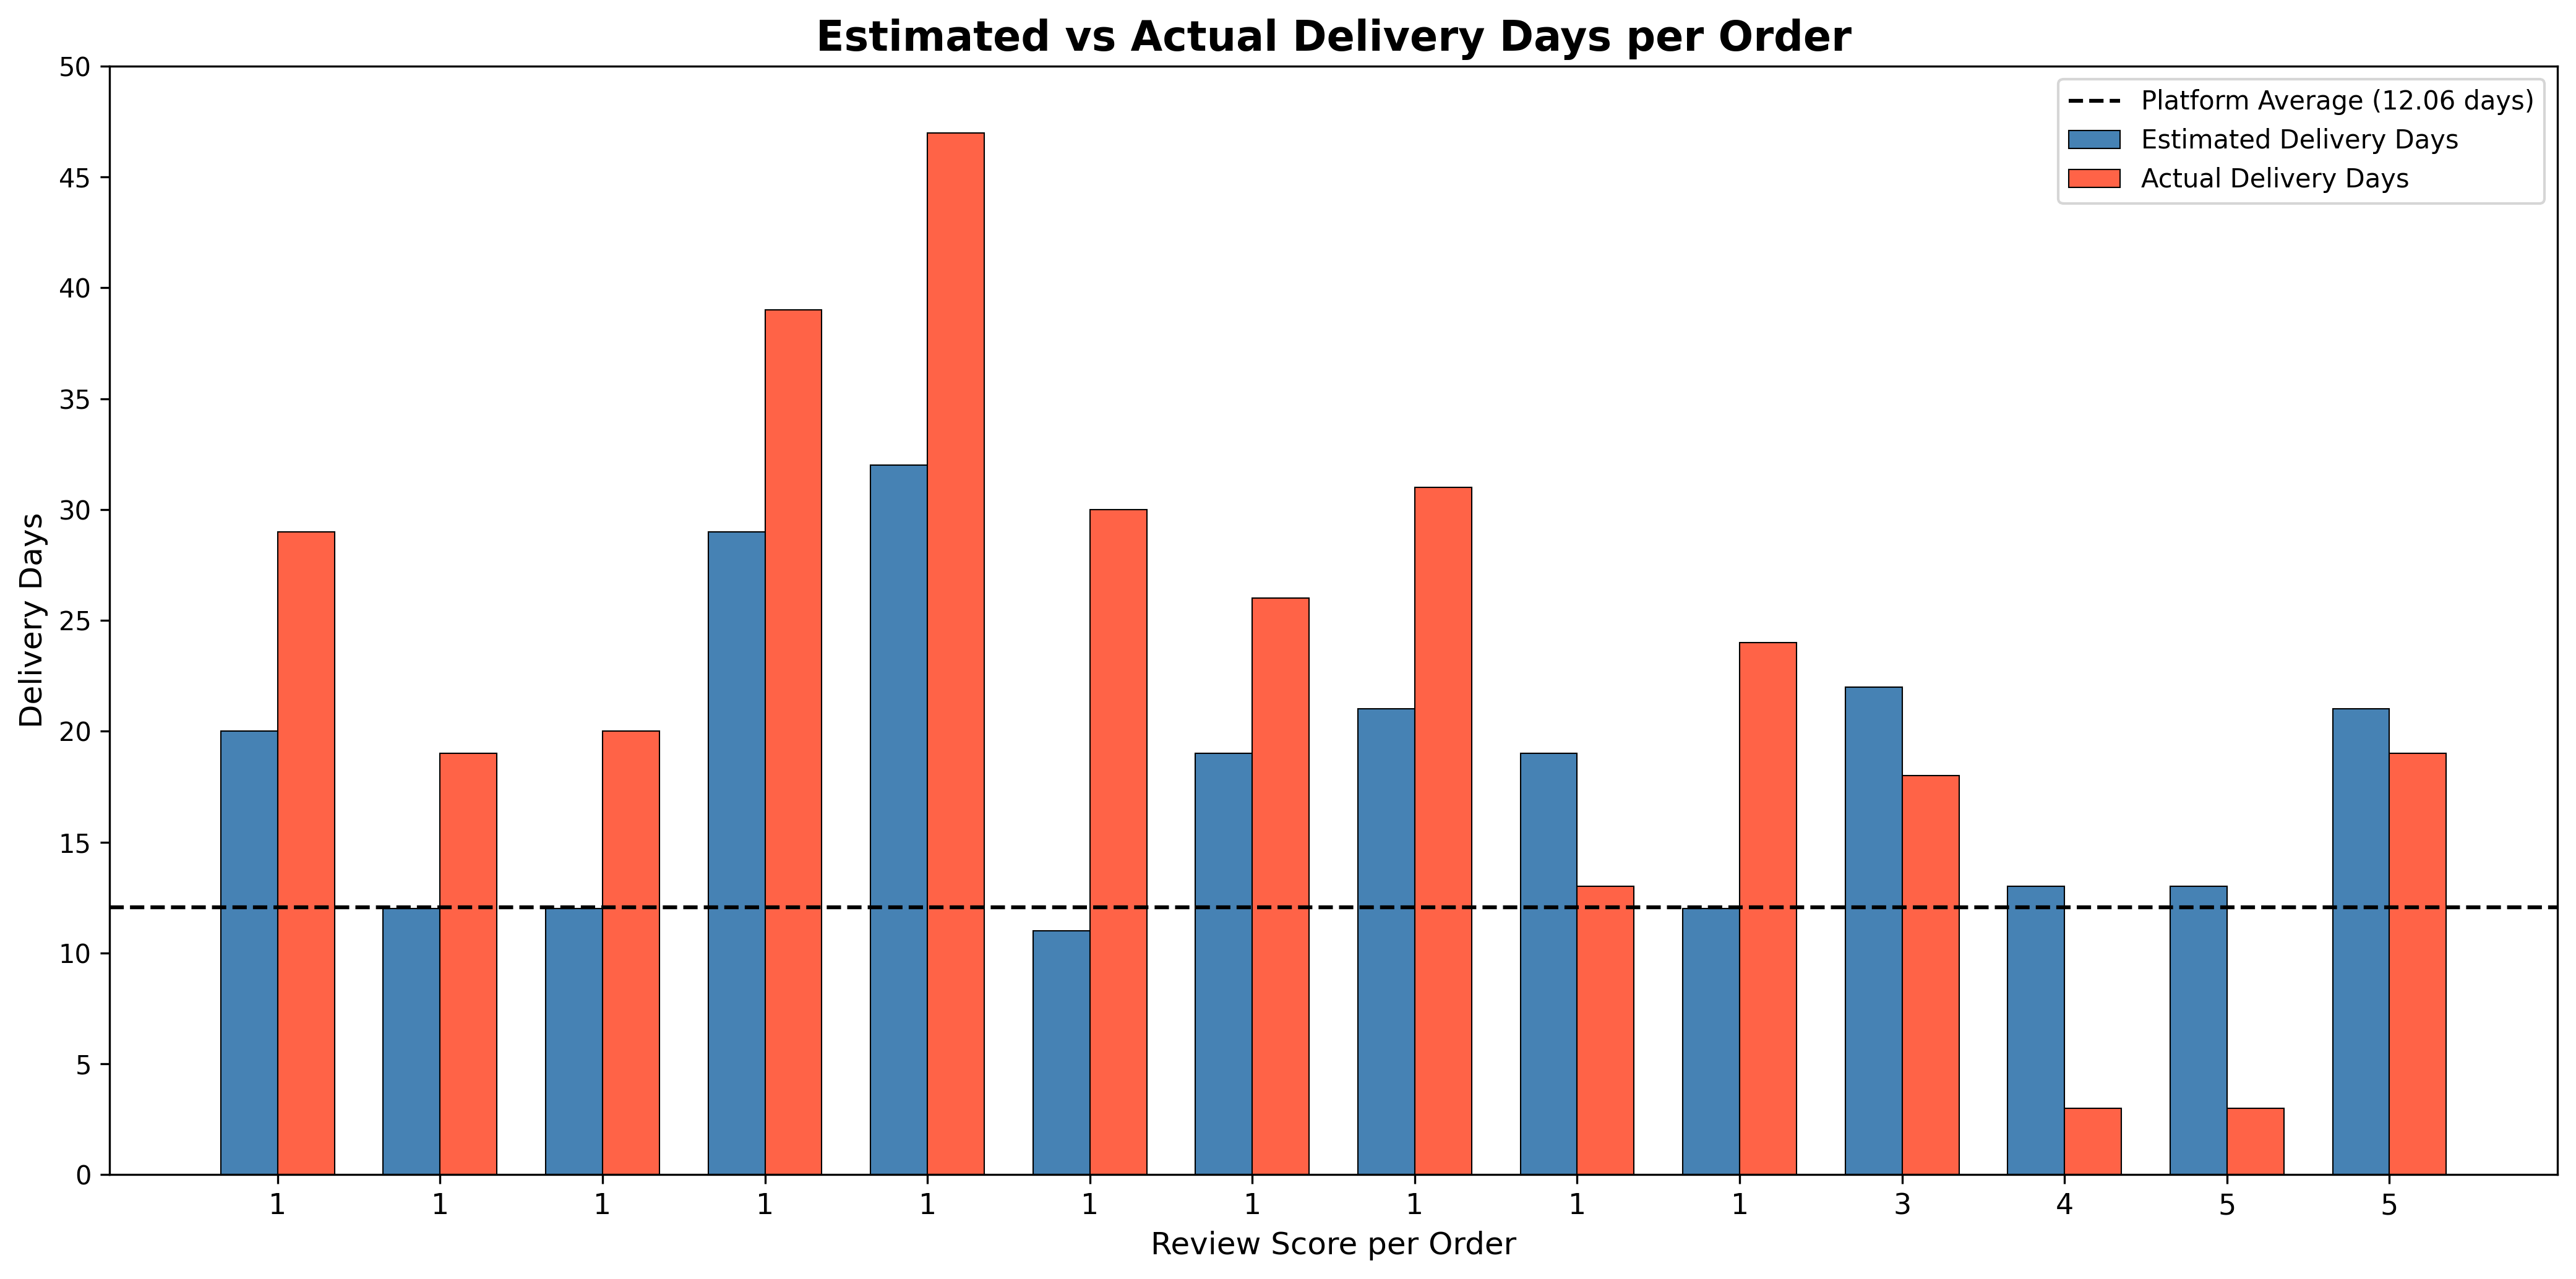
Leadership wanted a low-rated seller removed. I challenged the decision and found the real cause — dispatch delay, not product quality.

Objective

The Leadership had decided to remove a seller with a 1.93/5 average rating, citing poor products. I challenged the decision and ran a forensic investigation to identify the true root cause of the low ratings.

Approach

Built a raw-to-core PostgreSQL pipeline across 9 tables with a star schema (5 dim + 4 fact). Layered analytical views isolating dispatch time, carrier performance, distance correlation and customer review text. Python for wordcloud and visualisation only — logic stayed in SQL.

Result

Carrier delivered normally (8.00 vs 8.85 platform days). Distance was uncorrelated with rating. The seller's dispatch time averaged 21.11 days against a 2.74-day platform average — 7.7× slower. Recommended a 90-day improvement plan instead of removal.

03
Manufacturing & Operations Analytics · Power BI · SQLite3

Operational Performance Dashboards and Reporting

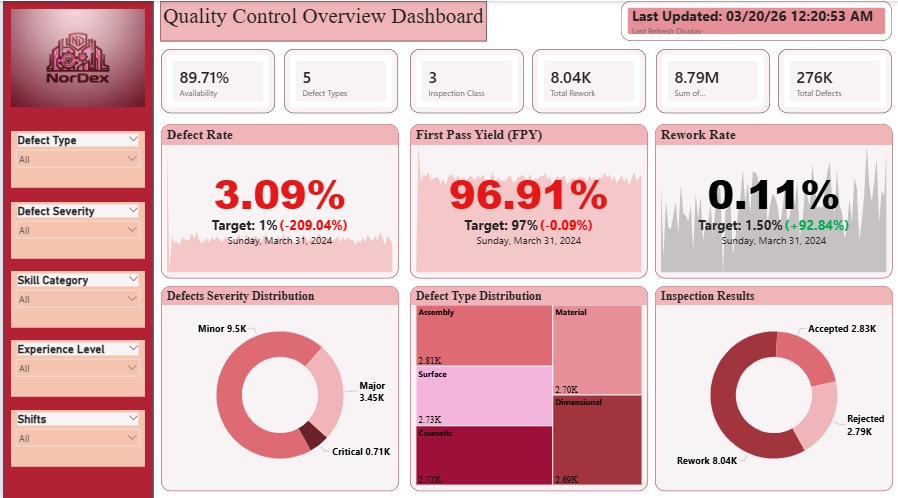
13,650 production events across three shifts, benchmarked against Industry 4.0 standards. Four interactive dashboards revealing where the line was haemorrhaging output.

Objective

NorDex had no centralised system to monitor shift performance, machine efficiency or quality in real time. Operational decisions were being made without data-driven insight and Industry 4.0 performance gaps were going unidentified.

Approach

Analysed 13,650 production events across three shifts. Built 15+ DAX measures — OEE %, Availability %, Performance %, Quality %, Defect Rate %, Labour Utilisation — benchmarked against Industry 4.0 and automotive manufacturing thresholds. Delivered four Power BI dashboards (Performance, Quality, Maintenance, Operators).

Result

Overall OEE at 54.92% vs an 80% target — critical. Night shift consistently last across every KPI with no expert-level operators assigned. Mechanical and electrical faults caused over 60% of all downtime. Performance % at 64.42% identified as the biggest single drag on OEE. Recommended staff/shift reallocation and training to improve Night shift performance

04
Brand Reputation Intelligence · SQL + Power BI

Emmason — Brand Reputation Analysis

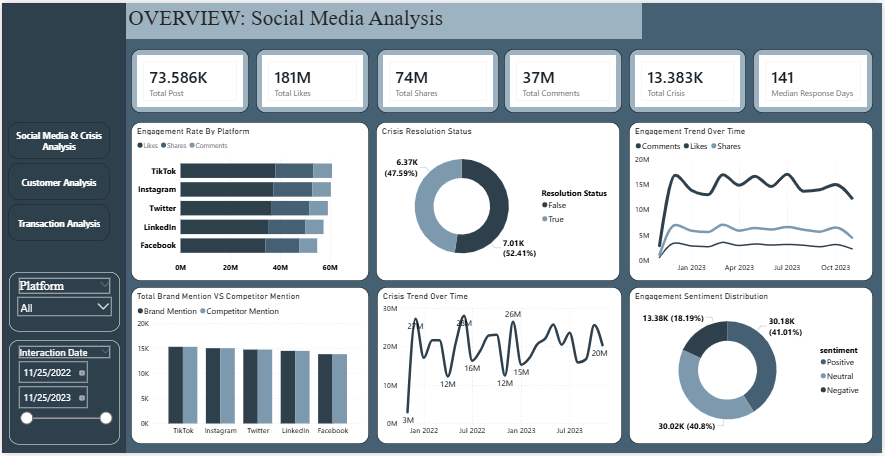
73,000+ transactions, $28.9M in revenue lost to product recalls, and a misleading YoY headline caught before it reached the executive report.

Objective

Emmason Consumer Electronics needed a systematic way to monitor brand reputation, customer behaviour and revenue across 73,587 transactions and a noisy social media surface — and an honest read on what was actually moving the numbers.

Approach

Normalised the raw dataset into three PostgreSQL tables with enforced foreign keys. Built a Power BI semantic model with DAX measures for segment-level analysis. Kept data validation logic in SQL, business logic in DAX — and cross-validated headline numbers between layers before they reached the deck.

Result

Identified $28.9M (50.23% of $57.53M total revenue) lost to product recalls — the single largest business risk. Crisis resolution rate of 47.59% with a 141-day median response time exposed a critical operational gap. Caught a misleading YoY revenue increase that was actually a data-coverage artefact, before it shipped.

05
HR analytics · Tableau

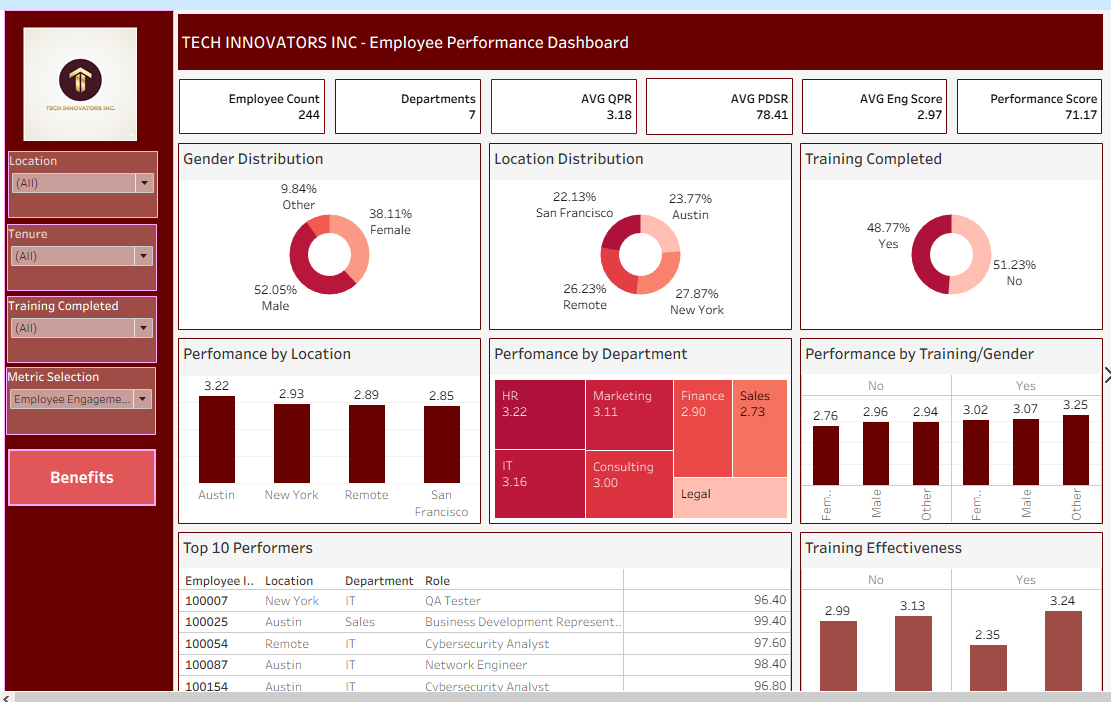
Tech Innovators — HR Performance & Benefits

Quantifying the performance multiplier of training versus benefits across 244 employees in seven departments.

Objective

HR leadership at Tech Innovators Inc. had limited visibility into real-time performance and benefit utilisation. Interventions were delayed, inconsistent and reactive — and benefits spend was growing without an ROI story.

Approach

Built a Tableau workbook joining three datasets — benefits (584 rows), demographics (244) and performance (244) — on Employee ID. Custom calculated fields for age-group segmentation. Cross-analysed performance against benefits, training completion and demographics.

Result

Trained benefit users showed a 37.87% QPR increase against only 4.68% for untrained — training is the performance multiplier, not benefits alone. Only 48.77% of employees had completed training. Gym membership had highest satisfaction at 41.29% despite low utilisation — a clear promotion opportunity at zero additional cost.

06
Web Analytics · Excel

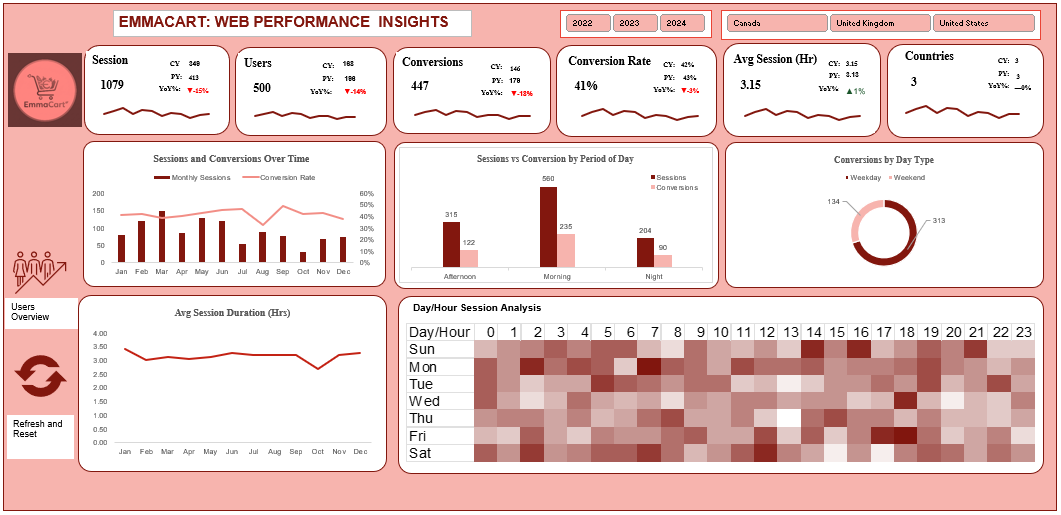
EmmaCart — Web Traffic & Performance

An end-to-end Excel analytics build for a 3-year online retail dataset — XLOOKUP, Pivot Tables, and two macro-enabled dashboards.

Objective

Analyse three years (2022–2024) of web traffic for an online retail store — 1,079 sessions — to identify conversion levers, traffic patterns, and the root cause of an unexplained YoY decline.

Approach

Built end-to-end in Microsoft Excel: ingestion, cleaning with XLOOKUP, segmentation via Pivot Tables, and two macro-enabled dashboards with VBA-powered Refresh, Reset and Switch Dashboard buttons. No external tools — pure Excel discipline.

Result

Conversion rate of 41% (–3% YoY). Weekends drove 70% of sessions; night visitors converted best at 44.11%. Identified Sunday 14:00–21:00 as the highest-engagement window of the week. Flagged –15% YoY session decline and 76.27% returning-visitor share as the customer-acquisition bottleneck.